

PATHS-UP2-R-Glucose_BarcodeFigure_V3 w caption (1)
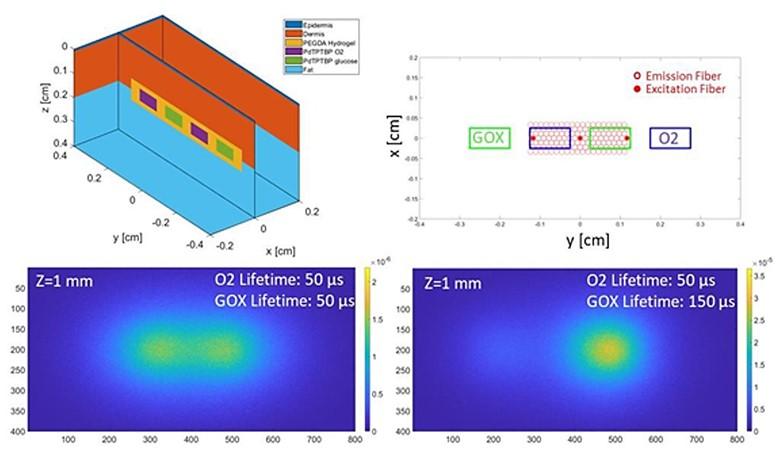
Monte-Carlo simulations for optimizing the array structure of the lens-less optical reader instrumentation to interrogate the implanted sensors. (Top) Schematic of the barcoded oxygen/glucose sensor (top left figure) and its alignment to the subset of 133 excitation/emission fibers (top right figure). The example uses three excitation fibers (filled red circles in top right figure) to calculate the phosphorescence emission-intensity distribution at the skin surface. (Bottom) Examples of the intensity distribution for a multiplexed (Glucose and O2) sensor located 1 mm under the skin surface. The bottom left image shows the calculated intensity distribution in absence of glucose (O2 sensor lifetime equals glucose sensor (GOX) lifetime), while the right image shows the response with glucose (higher GOX lifetime). The relative change in intensity distribution in the presence of glucose – with the intensity from the glucose-sensing compartment on the right side increasing substantially over that of the oxygen-sensing compartment on the left – demonstrates the efficacy of the sensor to respond specifically to glucose.