

TANMS4-CellSorting_Fig2.jpg
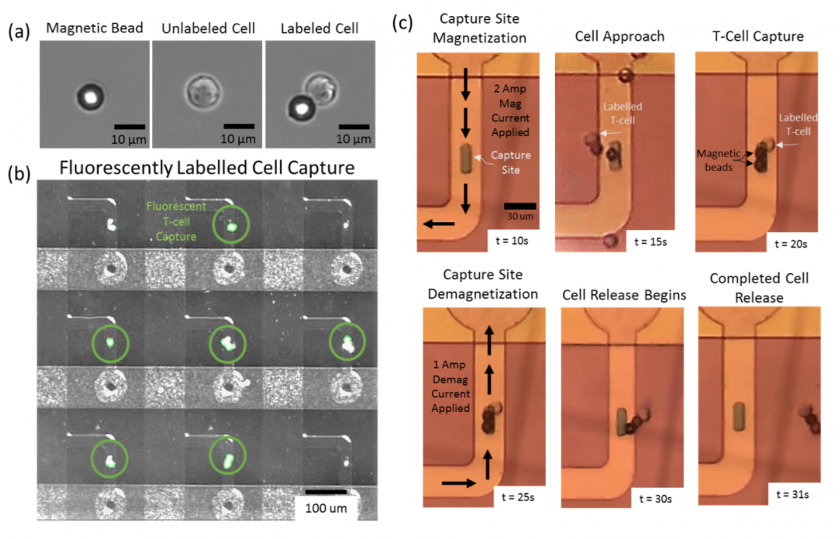
Figure 2. (a) Microscope images of an 8.5 um superparamagnetic bead, an unlabeled T cell, and a T cell tagged with one 10um superparamagnetic bead (b) Capture of magnetically labeled T-cells as seen under a fluorescence microscope. Cells were fluorescently labeled prior to their introduction into the microfluidic channel. (c) Time lapse microscope images of single magnetically labelled T-cell capture and release process. The first image shows the magnetization current pulse applied. The second image shows the captured T-cell with its two respective magnetic beads. The third image shows the demagnetization current applied in the opposite direction as the magnetization current and with half the magnitude. Finally, the fourth and fifth images show the cell and the magnetic beads releasing from the capture site.